First, I will compare Eurostat’s flash estimate of Q2 GDP (published last Friday) to the June Eurosystem staff projections.[1] Second, I will discuss the role of the pandemic emergency purchase programme (PEPP) in supporting the euro area economy and protecting medium-term price stability.
Second quarter GDP: the maximum impact of the pandemic
It has
long been clear that the maximum impact of the pandemic on economic
activity would fall in the second quarter. While the economy had already
taken a significant hit in the first quarter, the most extensive
lockdown measures were implemented in April. Higher-frequency data
indicate that there was some recovery during May and June (on account of
initial progress in stabilising the spread of the virus and the
associated easing of lockdown measures), but the scale of the April
contraction and the partial nature of the rebound in May and June meant
that the data would inevitably show a substantial decline in the average
level of economic activity during the second quarter.
Eurostat’s
preliminary flash estimate for euro area output in the second quarter
makes for sobering reading, with a quarter-on-quarter decline in GDP of
12.1 percent. Taken together with the 3.6 percent decline in the first
quarter, the cumulative decline in output in the first half of 2020 was
15.3 percent.
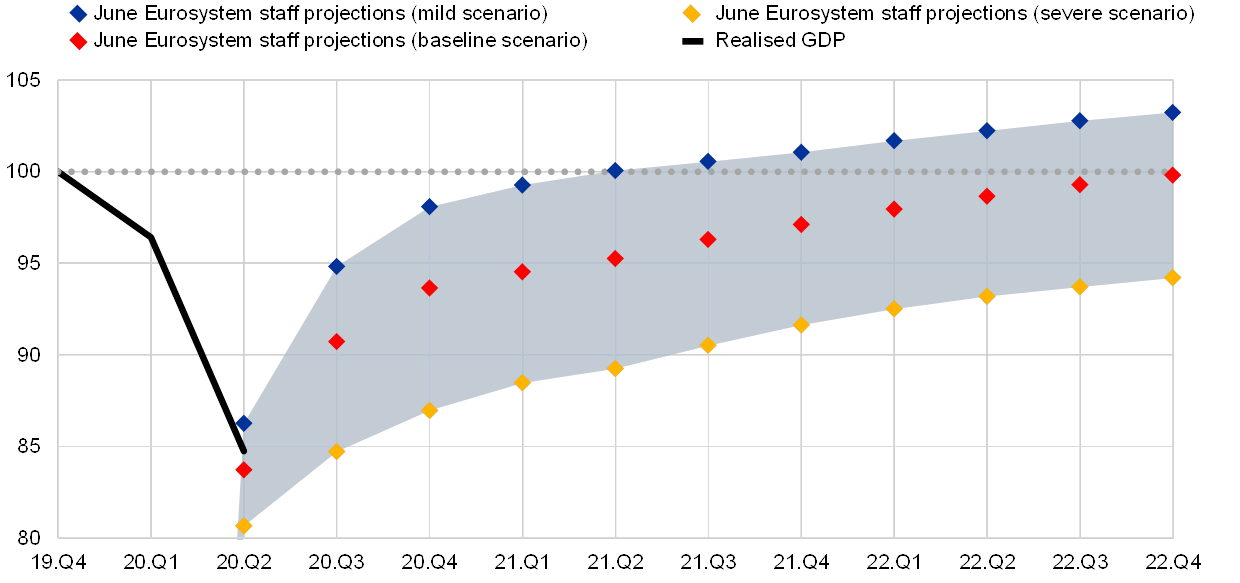
As shown in Chart 1, the second quarter outcome is
slightly less severe than the 13 percent decline envisaged in the June
Eurosystem staff projections. Across the range of scenarios studied by
the Eurosystem staff, the third quarter is projected to see a
significant increase in the level of economic activity, even if the
scenarios differ in terms of the overall duration and severity of the
pandemic shock, with the baseline only seeing a return to the
pre-pandemic level of economic activity in 2022.
Chart 1
Realised and projected output
(indexed real GDP, Q4 2019 = 100)

Sources: ECB and Eurostat.
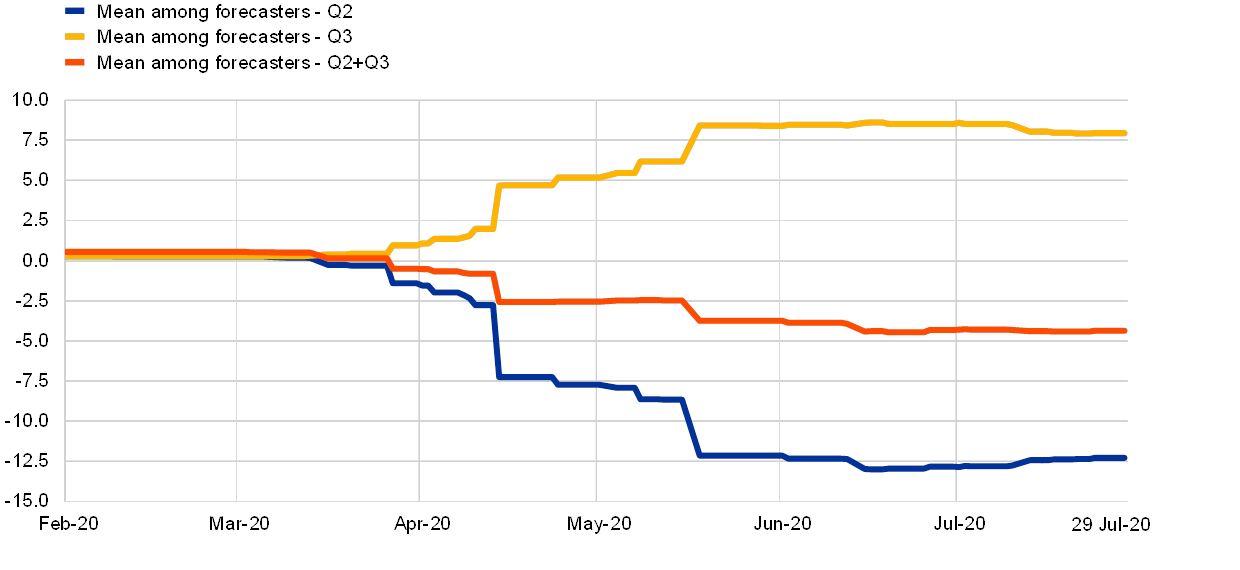
In
drawing inferences from the flash estimate published by Eurostat, it is
also important to take into account the negative correlation in many
forecast exercises between the second-quarter and third-quarter output
growth rates (see Chart 2). In particular, to the extent that the
unlocking of the European economy advanced more quickly in May and June
than was originally expected, this may imply a less-steep step up in
economic activity in the third quarter, with more sectors transitioning
from the reopening phase to a more gradual growth rate. Accordingly, it
would be unwise to draw strong conclusions from the second quarter
outturn: at the least, the data for the second and third quarters should
be jointly assessed.
Chart 2
GDP growth forecasts by private banks for the second and third quarters of 2020
(percentages)

Source: Bloomberg.
Notes:
Private forecasts are provided by the 29 largest commercial and
investment banks. “Mean” refers to the average of the forecast among
private banks. The latest observations are for 29 July 2020.
In
analysing the prospects for the third quarter, the containment of the
virus remains the most important factor. The rise of new coronavirus
(COVID-19) cases in parts of Europe over the past couple of weeks has
led to renewed local containment efforts and revised travel guidelines.
In addition to the direct adverse impact on some sectors (especially
tourism), setbacks in the containment of the virus are also weighing on
consumer and investor sentiment. In a similar vein, the resurgence in
COVID-19 transmission rates in a number of major non-euro area economies
is dampening sentiment and impairing spending in those economies, with a
measureable impact on the external demand for euro area exports.
More
generally, the exceptionally-elevated uncertainty about the evolution
of the pandemic continues to dampen business investment. Taken together,
actual and expected declines in employment and income can be expected
to keep precautionary household savings at elevated levels. Moreover,
while overall bank lending conditions remain favourable, the second
quarter bank lending survey signals that banks expect a net tightening
of credit standards for loans to firms, in part related to the projected
tapering-off of state credit guarantee schemes. These factors help to
explain why the economy is expected to take a significant amount of time
to recover fully from the pandemic shock and why significant fiscal and
monetary policy support is necessary.
The role of the PEPP in supporting the euro area economy
As
the severity of the economic and financial implications of the pandemic
crisis became apparent, the ECB adopted a series of measures to ease
financial conditions in order to avoid adverse feedback loops between
the financial system and the real economy, support confidence and
proactively respond to the downward shift in the outlook for growth and
inflation.
More specifically, the ECB acted through its liquidity operations and
asset purchases, which included the establishment of the PEPP.
As I described in an earlier blog post, the PEPP has a dual role.
First, alongside the ECB’s other monetary policy instruments, asset
purchases are the most important mechanism for delivering the additional
monetary accommodation required to support the economic recovery and
safeguard price stability in the medium term. Second, the flexibility
embedded in the PEPP – across time, asset classes and jurisdictions – is
essential in enabling the ECB to stabilise financial markets in an
efficient and effective manner.
Let me begin by discussing the
latter role in more detail. The PEPP’s market stabilisation function has
proved successful in recent months, with the ECB making use of the
PEPP’s flexibility by frontloading asset purchases and directing them to
those market segments where they have been most warranted. The risk of
fragmentation has been significantly reduced since the onset of the
pandemic crisis.
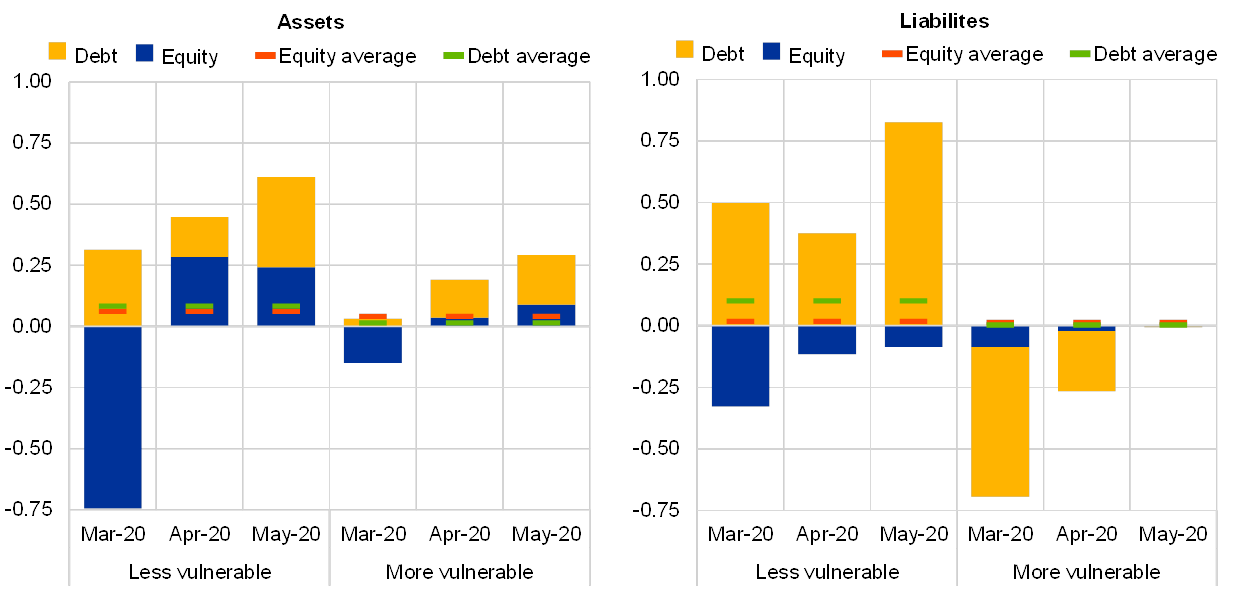
Chart 3 illustrates this point with balance of
payments data for March, April and May across two country groups (less
vulnerable and more vulnerable). Following the severe fragmentation
patterns that began to develop in March – patterns consistent with the
nature of a flight-to-safety episode – signs of stabilisation emerged in
April and were even more evident in the May data. On the asset side,
net inflows into both less and more vulnerable countries increased (left
panel); on the liability side, net outflows of debt securities issued
by more vulnerable countries came to a halt, after two months of
sizeable net sales (right panel).
Chart 3
Cross-border portfolio investment flows by country group – assets and liabilities
(monthly flows as a percentage of euro area GDP)

Sources: ECB and Eurostat.
Notes:
Data recorded on the basis of the Sixth Edition of the IMF Balance of
Payments and International Investment Position Manual (BPM6). Averages
calculated from January 2008 to May 2020. “Less vulnerable” countries
are Austria, Belgium, Finland, France, Germany and the Netherlands;
“more vulnerable” countries are Greece, Italy, Portugal and Spain.
The
success of the PEPP’s market stabilisation role to date, combined with
the flexibility embedded in the programme, has allowed for adjustments
in the timing and composition of purchases in line with the evolution of
market conditions. Taking this into account, and keeping in mind the
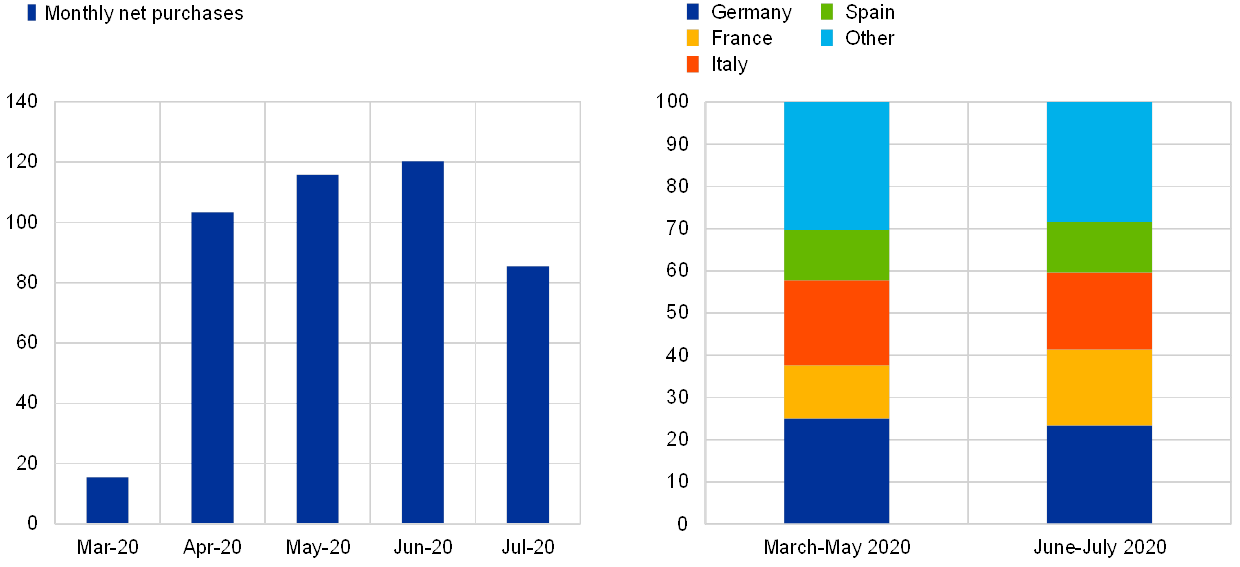
usual summer lull in market activity, the latest PEPP data releases show
that there has been a reduction in the pace of PEPP purchases in July
(see Chart 4, left panel). Purchases of public sector securities in
those countries that were most affected early on by the pandemic have
also been adjusted as market conditions have improved (see Chart 4,
right panel).
However, while the monthly pace and composition of
the PEPP can be flexibly adjusted in line with the risks to market
stability and the transmission mechanism, the overall envelope of PEPP
purchases is a core determinant of the ECB’s overall monetary stance.
In line with the ECB’s price stability mandate, the inflation outlook
plays the central role in determining the appropriate monetary stance.
Prior to the pandemic, the December 2019 Eurosystem staff projections
for the euro area foresaw annual HICP inflation at 1.6 percent in 2022.
In the June 2020 staff projections, the outlook for HICP inflation in
2022 had been revised downwards to 1.3 percent. This downward revision
to the inflation outlook motivated the scaling-up of the PEPP envelope
from €750 billion to €1,350 billion at the June meeting of the ECB’s
Governing Council.
Chart 4
Eurosystem purchases under the PEPP
(left
panel: total monthly net purchases, EUR billions; right panel:
geographical distribution of public sector securities purchases,
percentages of total public sector securities purchases during
respective period)

Source: ECB.
Notes:
End-of-period book values. Figures are preliminary and may be subject
to revision. The monthly purchase volumes are reported on a settlement
basis and net of redemptions.
Conclusion
In summary,
while there has been some rebound in economic activity, the level of
economic slack remains extraordinarily high and the outlook highly
uncertain. Further progress in persistently containing the virus will be
central in determining the size and speed of the economic recovery,
together with sufficiently-supportive fiscal and monetary policies. In
tandem with the appropriate calibration of national fiscal policies and
the various EU-level initiatives already announced in April, the
recently agreed Next Generation EU (NGEU) instrument will be vitally
important in ensuring sufficient fiscal support across EU Member States
in the coming years. For our part, the ECB is committed to providing the
monetary stimulus needed to support the economic recovery and secure a
robust convergence of inflation towards our medium-term aim.
ECB
© ECB - European Central Bank
Key

Hover over the blue highlighted
text to view the acronym meaning

Hover
over these icons for more information

Comments:
No Comments for this Article