
|
|
HMRC has just published statistics for trade in goods for December 2023, giving us three years of data after the implementation of the Trade and Cooperation Agreement (TCA) with the EU in 2021.
There is good and bad news for UK trade in goods. Starting with the bitter pill, the UK’s trade in goods with the world has underperformed compared to other comparable countries over the last few years. Figure 1 shows the exports (panel a) and imports (panel b) of the UK, marked in red, and other OECD countries in blue, together with the series for the OECD total in dark blue. While during the period 2013-16, the UK was in line with the OECD total, the UK’s imports and exports started to slow down since the Brexit referendum in June 2016. For exports, the gap with the OECD total increased substantially with the Covid-19 pandemic. Imputing causation in this setting is not easy; most likely, the Brexit referendum, a slow recovery from the pandemic and the UK’s exit from the EU all contributed to the underperformance of UK trade.
A) Exports B) Imports
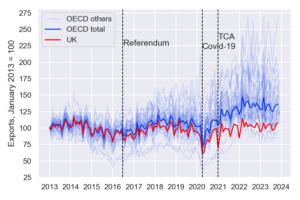
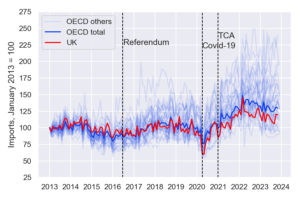
Source: author’s calculations based on OECD data. Trade is measured on a Balance of Payment method.
Our second bit of analysis looks at the geography of the UK’s trade by comparing UK trade with the EU to trade with other non-EU countries (ROW). With the caveats of having preliminary data for 2023, here comes the sweet news: three years after the TCA, the UK’s trade with the EU relative to non-EU is back to normal.
As shown in Figure 2, exports were affected only in January 2021, the month of entry into force of the TCA. But this is old news. Imports on the other hand were down by about 20-30% over the period 2021-22, but by the end of 2023, they have also recovered to pre-TCA levels relative to non-EU imports.
A) Exports B) Imports
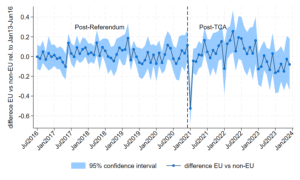
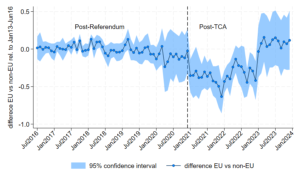
Source: author’s calculations based on HMRC data. The figure reports the difference-in-difference coefficients of a PPML regression with partner-by-calendar month and time-fixed effects. The sample includes UK trade with the EU members and a control group composed by OECD+BRICS countries excluding Canada and Japan as FTAs between the EU and these countries entered into force in the period considered. We removed gold (HS 7108) and minerals (HS 27) from total trade due to the volatility of these products. Results are subject to some caveats, which we tried to address, as detailed below, to ensure that the results are robust.