
|
|
As part of its NextGenerationEU (NGEU) post-COVID-19 recovery and economic greening plan, the European Union intends to borrow about €421 billion (in current prices) before the end of 2026 to fund “non-repayable support” to EU countries. This debt and the interest on it must be repaid before 2058 from the EU budget. Here, we estimate what these costs could amount to 1 .
The costs will depend mainly on the future trajectory of interest rates paid by the EU. Predicting interest rates for such a long time horizon is challenging but market expectations (based on interest rate swaps) provide a good baseline. For instance, market expectations are that 10-year rates will remain relatively stable until 2030, before slowly falling and stabilising at a lower level in the long run. Investors anticipate the 10-year euro swap rate, which closely mirrors EU yields (with a small spread, typically around 10 basis points on 10-year rates), declining towards 1.8 percent by 2058 (Figure 1, Panel A).
The uncertainty surrounding this expectation can be gauged by analysing the expected volatility of future interest rates. Probabilities that market participants attach to different future interest rate trajectories can be derived from swap-options. This exercise indicates considerable uncertainty about the future path of nominal euro rates. There is a 50 percent probability that rates will fall within the range of -0.4 percent to 3.4 percent in 2058, while the 90 percent confidence interval ranges from -4.1 percent to 6.2 percent (Figure 1, Panel A).
While the median trajectory for nominal rates represents a substantial increase compared to prevailing market expectations at the start of the borrowing programme in 2021, it is useful to also consider the change in real terms. Figure 1 Panel B compares 2021 and current market expectations for the 10-year real interest rate on EU debt. In 2021, these expectations were negative for the entire period of the programme, making EU borrowing profitable in real terms. But since 2021, these expectations have moved up, resulting in a real rate of 0.92 percent in 2028, when new net issuance will end, before returning to negative levels after 2043. Thus, the real cost of EU debt is no longer expected to be negative, but the low average real rates indicate much lower interest costs than nominal rates might suggest.
Figure 1: 10-year euro swap rates, real interest rates, and market expectations (in %)
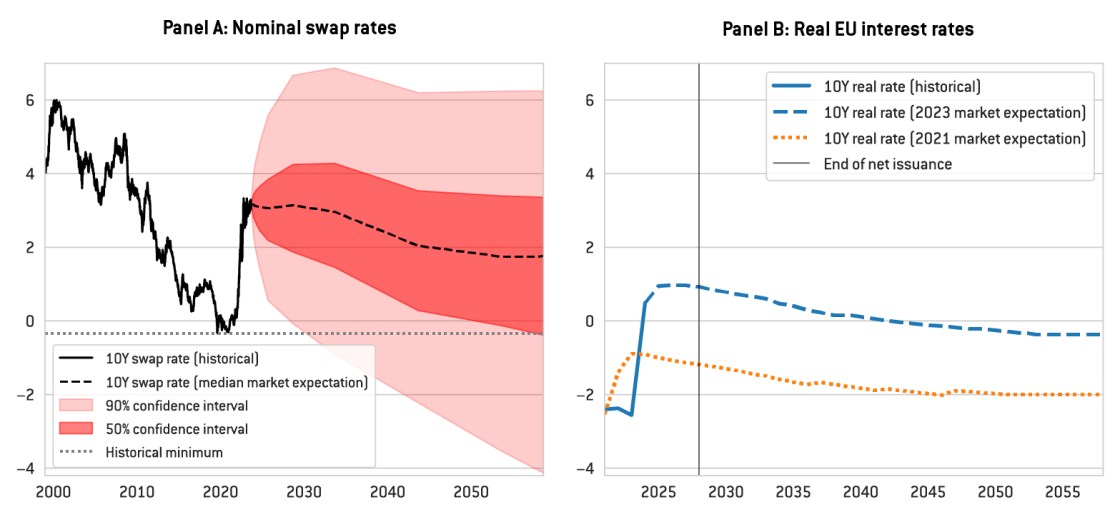
Source: Bruegel based on Danske Bank and Bloomberg. Notes: Panel A shows historical and possible future values of the 10-year euro swap rate, which reflects market expectations of the average short-term rate over the next 10 years and can thus be considered a good proxy for the 10-year EU yields. Dark and light red shaded areas correspond to the 50 percent and 90 percent confidence intervals, respectively, as defined by risk-neutral probabilities derived from the option prices on 10-year-swap rates. Panel B shows historical and expected real interest rates for 10-year EU debt, based on 10-year euro swaps corrected for the average swap-EU yield spread and market inflation expectations.
To project the interest charges that will have to be paid from the EU budget, we combined these interest rate expectations and their volatility with information on the EU stock of debt, projections for future funding needs, the current distribution of debt maturities and spreads between swap rates and EU bond yields (see the annex for details). However, we judge the probability of extreme negative rates (anticipated by the market and resulting from the methodological assumptions of the pricing model) to be exaggerated, and thus we assume that future European rates cannot drop below their historical minimum, ie that 10-year swap rates will not go below their 2020 level of minus 0.33 percent (dashed grey line in Figure 1, Panel A) 2 .
Our results show that yearly interest costs could increase to €10.8 billion in 2030 in the baseline trajectory (ie 0.05 percent of expected EU GDP), before decreasing gradually up to 2058. Total interest costs up to 2058 could amount to around €222 billion (ie 0.6 percent of the expected 2021-58 average of EU GDP; see bold numbers in Figure 2). Because of the significant uncertainty about future interest rates, interest costs may vary substantially around baseline estimates. With a 50 percent probability, interest costs could fall within the €8.2 billion to €13.2 billion range in 2030, while the 90 percent confidence interval ranges from €3.9 billion to €
Figure 2: Projected annual and total interest costs borne by the EU
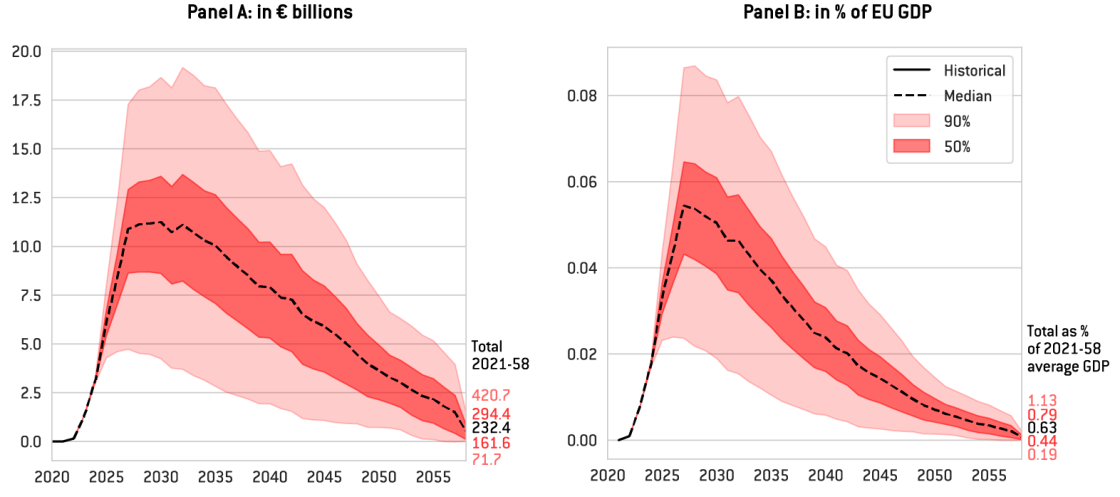
Source: Bruegel based on Danske Bank, Bloomberg and European Commission. Notes: Panel A presents historical and projected annual interest rate costs (lines, LHS) and total costs in 2021-2058 (numbers in bold, RHS) borne by the EU, in current prices. Fifty percent and 90 percent confidence intervals are based on option implied interest rate volatilities (see the annex). Panel B presents the same costs over projected nominal EU GDP, and the estimated share of total costs in 2021-2058 in average annual EU GDP (numbers in bold, RHS).
Starting in 2028, when a new budget cycle begins, the EU budget will also need to include provisions for the repayment of the EU debt, in addition to interest costs. However, the debt issued between 2021 and 2026 will not necessarily need to be reimbursed immediately when it matures, as the legislation allows for some rollover after 2027, to enable a smooth decline in EU debt.